

Forecasting
The budget, the forecast, and the gap between them.
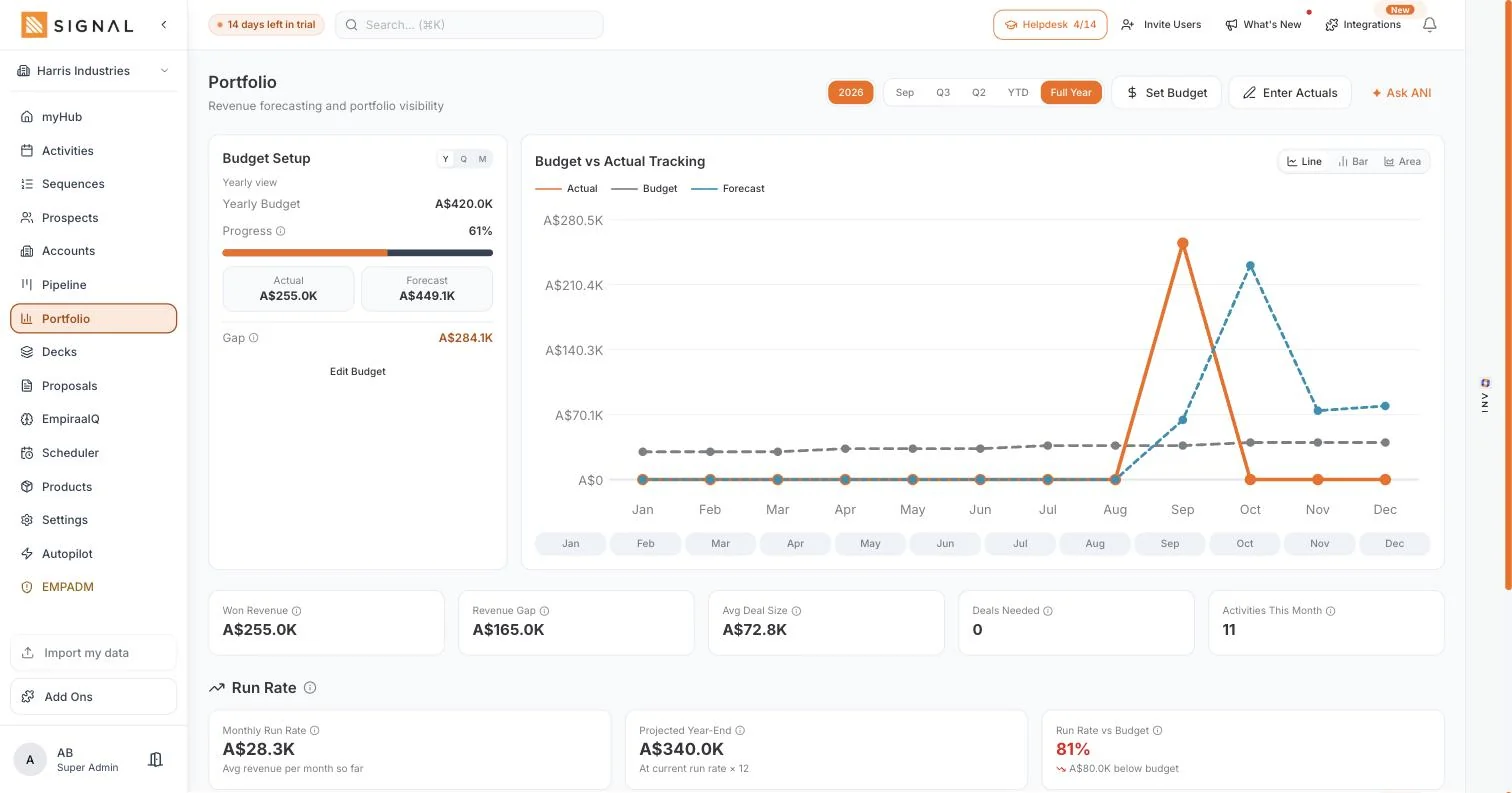
Portfolio is the screen for whoever carries the number. Your yearly budget, what you have actually won, what the pipeline says you will win, and the distance still to cover, worked out from real deals rather than rebuilt in a spreadsheet every month.
14 days free. No credit card.
- 14 days free
- No credit card
- Unlimited users
The problem
The forecast is built the night before.
Which is why nobody trusts it, including the person who built it.
Three familiar failures
It is a spreadsheet rebuilt monthly
Exported, pasted, adjusted by feel, and out of date by the time the meeting starts. Four hours a month to produce a number with a warning attached.
There is no budget beside it
A pipeline total on its own says nothing. The only question that matters is whether it clears the number you committed to, and that needs both figures on one screen.
Nobody sees the gap early
A shortfall found in month ten cannot be fixed. Found in month three, it is a quarter of extra prospecting and an uncomfortable conversation, which is a much better outcome.
How it works
One screen, four numbers.
Budget, actual, forecast, gap. Everything else on the page explains one of them.
Portfolio
Your budget, and progress against it
Set the yearly number you are working to and Portfolio holds it in front of you. Progress is measured against that commitment rather than against last month, which is the comparison that actually decides whether the year works.
- A yearly budget you set, not a target the software invents
- Actual revenue from closed deals rather than from a report you run
- Progress shown as a share of the number, so the picture is immediate
Forecast revenue, from the deals you have
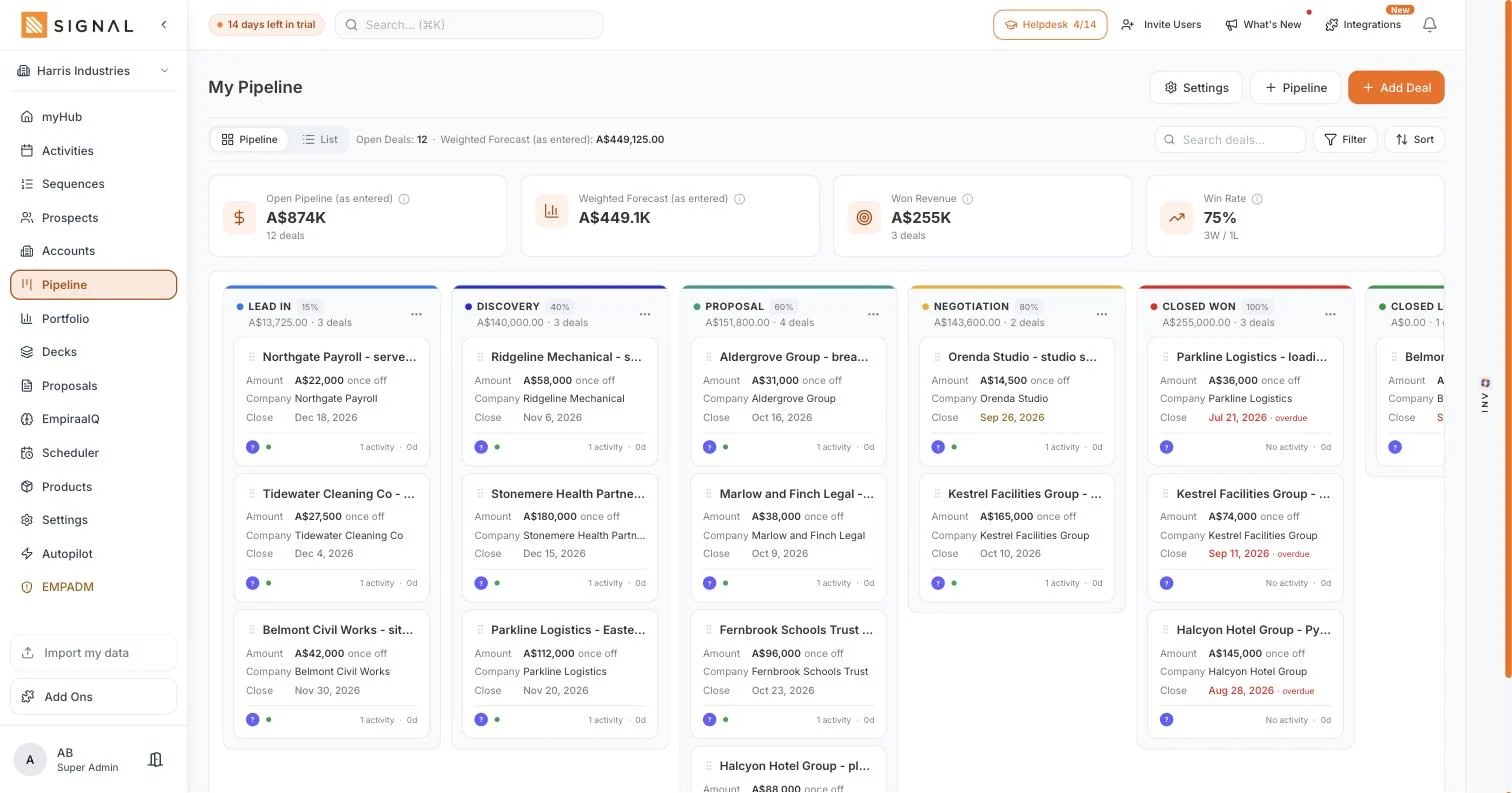
The forecast comes from the pipeline, weighted by the stage each deal is genuinely in. Move a deal and the forecast moves, which is what makes it a live number instead of a monthly exercise.
- Weighted from stage probabilities you set yourself
- Updates as deals move, with no report to run
- The gap between forecast and budget, stated plainly
And run rate, which answers the real question
Budget against actual by month shows where the year has been. Run rate against budget shows where it is going if nothing changes. Together they turn a forecast into a decision about what to do this week.
- Budget against actual, month by month
- Run rate against budget, so a slow quarter is visible while it can still be fixed
- The same numbers behind targets and coverage, when you want to work back to activity
What you get
A forecast you could take to a board.
In Portfolio
Yearly budget
The number you committed to, on the same screen as the number you are tracking to.
Actual revenue
From closed deals, so it matches what the business actually banked.
Forecast revenue
Weighted from real pipeline, updating as deals move rather than monthly.
The gap
Stated as a figure. Not implied by two charts that need mental arithmetic.
Budget against actual by month
Where the year has been, so a soft quarter is not an argument.
Run rate against budget
Where the year is going at today’s pace, which is the line people act on.
Blindspots and focus
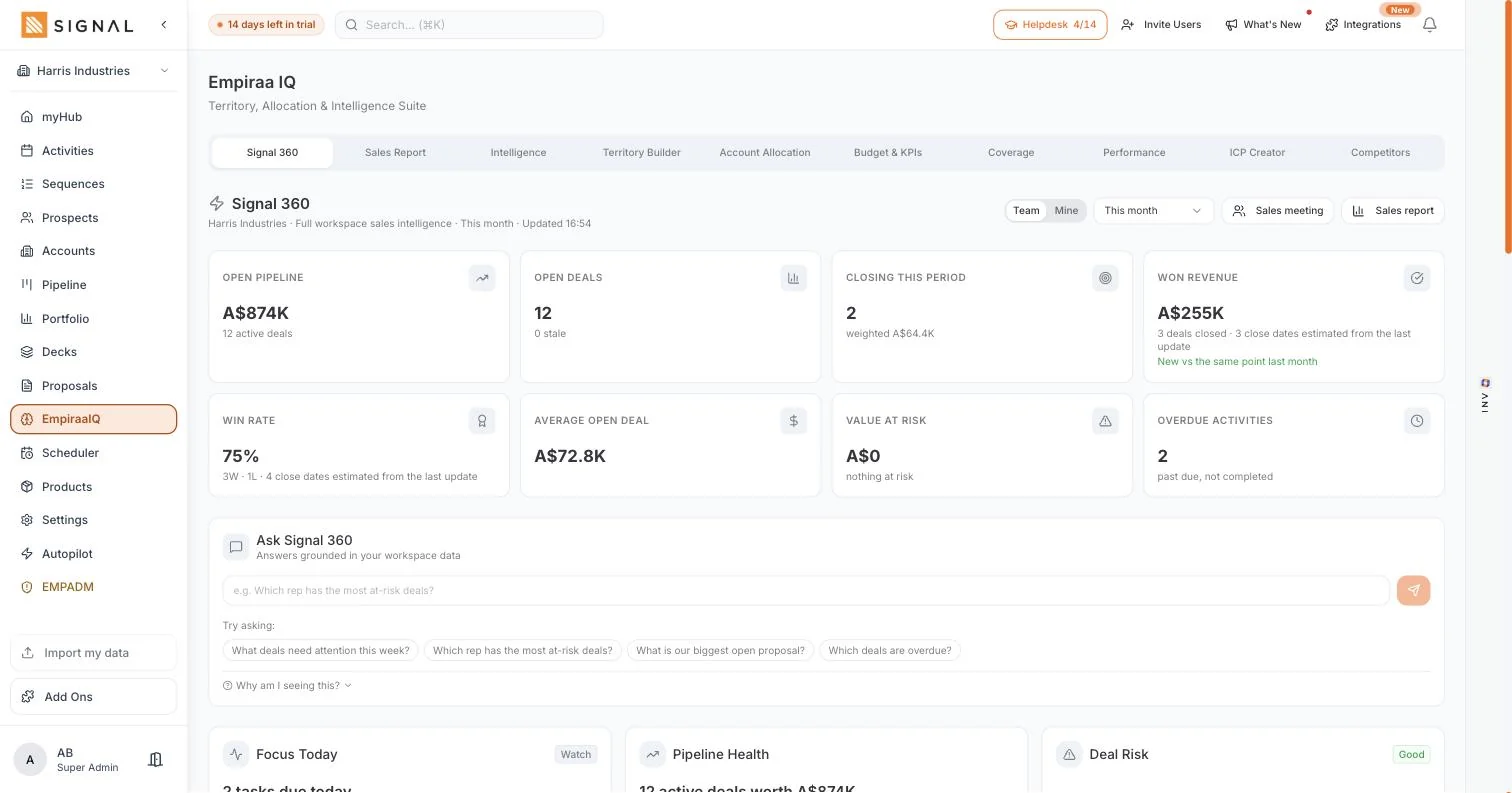
Deals with no next step, aging deals, zero touchpoint deals and stalled prospects, counted.
Ask ANI about it
A question about the numbers on the screen, answered from your own workspace.
Learn moreProposals in the total
Deals and proposals combined without counting the same revenue twice.
Learn moreGetting started
A real forecast in an afternoon.
Four steps
- 10 minutes
Import the pipeline
Deals, values, stages and close dates. ANI maps the columns.
- 10 minutes
Set the stage probabilities
Honest ones. A generous Proposal stage makes every number after it wrong.
- 2 minutes
Enter the yearly budget
The number the business is actually working to this year.
- 10 minutes
Look at the gap
Then decide whether the answer is more pipeline, better conversion or an earlier conversation.
By role
What it changes, seat by seat.
Who feels it
A CEO or owner
A forecast you can defend, because every figure traces back to a deal, a stage and a date.
Learn moreA sales manager
The monthly forecast stops being four hours of spreadsheet work the night before.
Learn moreA founder
You can see the year working or not working while there is still time to change it.
Learn moreA team hitting a number
The gap is shared rather than announced, which is a different conversation entirely.
Learn moreQuestions
Forecasting questions, answered.
Where does the forecast come from?
From your open deals, each counted at the probability of the stage it is in. Nothing is estimated on your behalf, and because you set the probabilities you can explain the number in one sentence. More on the pipeline.
Can I set my own budget?
Yes. Portfolio holds the yearly number your business is working to, and progress, the gap and run rate are all measured against it rather than against a figure the software picked.
How often does it update?
As you work. Moving a deal, winning one or changing a close date changes the numbers straight away, so there is no report to run and no monthly rebuild.
What is run rate against budget?
Where the year lands if the current pace continues. It is the quickest way to see a shortfall while there is still time to do something about it, rather than in month ten when there is not.
Can I see what the number means for activity?
Yes. Targets and coverage works back from the number to the pipeline and the activity required to reach it, so a gap turns into a plan instead of a warning. Targets and coverage.
Do I pay extra for reporting or for extra users?
No. Portfolio is part of every plan and every plan includes unlimited users, so the people who need to see the number can see it without another licence. See pricing.

Question not answered here? Ask ANI and get a straight answer.
Stop rebuilding the forecast every month.
14 days free. No credit card. Unlimited users from the first minute.